Multiple Choice
Students in a Political Science course were asked to describe their politics as "Liberal","Moderate",or "Conservative." Here are the results: Which graphical display shows the marginal distribution of politics in the class?
I 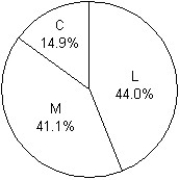
II 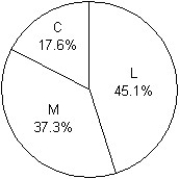
III 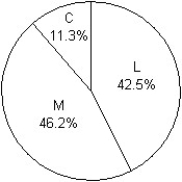
A) III
B) II
C) I
D) I,II,III
E) None of these displays show the marginal distribution of politics in the class.
Correct Answer:

Verified
Correct Answer:
Verified
Q20: A college examined the impact of
Q21: Just how accurate are the weather
Q22: Students in a political science course
Q23: The Centers for Disease Control in
Q24: A company held a blood pressure
Q26: Students in a Political Science course
Q27: Students in a political science course
Q28: A company held a blood pressure
Q29: From a sample of individuals the following
Q30: A real estate company kept a