Multiple Choice
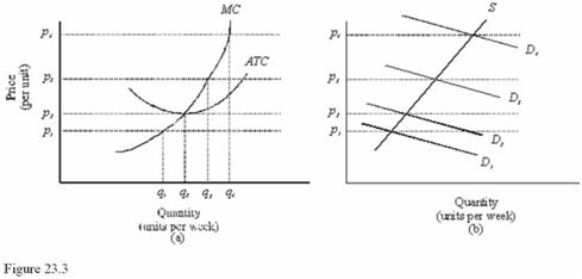 In Figure 23.3, diagram "a" presents the cost curves that are relevant to a firm's production decision, and diagram "b" shows the market demand and supply curves for the market.Use both diagrams to answer the following question: In Figure 23.3, at a price of p2 in the long run
A) Firms will enter the market.
B) Economic profits equal zero.
C) Firms will exit the market.
D) P = AVC.
Correct Answer:

Verified
Correct Answer:
Verified
Q8: Diagram a model of a perfectly competitive
Q43: When firms in a competitive market are
Q55: In which of the following cases would
Q99: <img src="https://d2lvgg3v3hfg70.cloudfront.net/TB5718/.jpg" alt=" Refer to Figure
Q101: Which of the following is not a
Q102: <img src="https://d2lvgg3v3hfg70.cloudfront.net/TB5718/.jpg" alt=" Refer to Figure
Q106: Bib's Soccer Ball Company produces 800 soccer
Q108: <img src="https://d2lvgg3v3hfg70.cloudfront.net/TB5718/.jpg" alt=" In Figure 23.3,
Q113: In a perfectly competitive industry,economic profit:<br>A)Can persist
Q120: Economic losses are a signal to producers<br>A)That