Multiple Choice
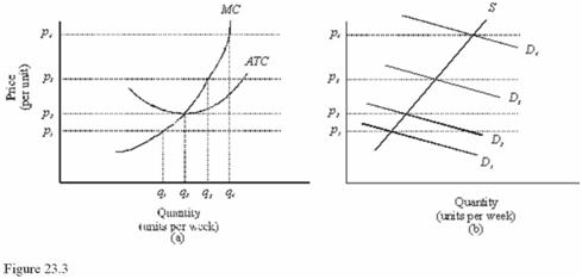 In Figure 23.3, diagram "a" presents the cost curves that are relevant to a firm's production decision, and diagram "b" shows the market demand and supply curves for the market.Use both diagrams to answer the following question: In the long run, at prices below p2 in Figure 23.3,
A) There is economic profit.
B) The firm will produce the quantity where MC = MR.
C) Firms will enter the market.
D) Firms will exit the market.
Correct Answer:

Verified
Correct Answer:
Verified
Q25: A profit-maximizing producer seeks to<br>A)Maximize profit per
Q51: Which of the following is a production
Q96: The behavior expected in a competitive market
Q102: A firm should shut down production when<br>A)P
Q114: Most product markets are perfectly competitive.
Q135: Which of the following is not a
Q136: <img src="https://d2lvgg3v3hfg70.cloudfront.net/TB5718/.jpg" alt=" Refer to Figure
Q140: <img src="https://d2lvgg3v3hfg70.cloudfront.net/TB5718/.jpg" alt=" Refer to Figure
Q144: <img src="https://d2lvgg3v3hfg70.cloudfront.net/TB5718/.jpg" alt=" Refer to Figure
Q147: In a perfectly competitive market,firms will earn