Multiple Choice
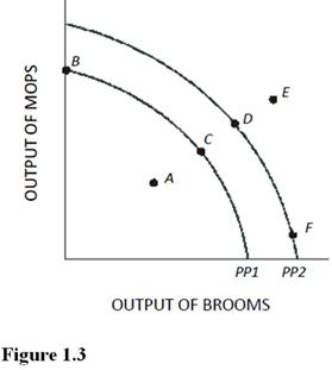 An increase in the proportion of the population that is unemployed above the normal rate is best represented in Figure 1.3 and using PP1 by a movement from point
A) C to point D.
B) D to point C.
C) C to point A.
D) E to point D.
Correct Answer:

Verified
Correct Answer:
Verified
Q13: Greater regulation to correct the imbalances in
Q14: Table 1.3 shows the hypothetical trade-off
Q15: Government intervention may achieve a more optimal
Q16: <img src="https://d2lvgg3v3hfg70.cloudfront.net/TB5718/.jpg" alt=" In Figure 1.3,
Q17: Table 1.3 shows the hypothetical trade-off
Q19: <img src="https://d2lvgg3v3hfg70.cloudfront.net/TB5718/.jpg" alt=" Refer to Figure
Q20: Table 1.2 shows the hypothetical trade-off
Q21: <img src="https://d2lvgg3v3hfg70.cloudfront.net/TB5718/.jpg" alt=" Refer to Figure
Q22: Table 1.1 shows the hypothetical trade-off
Q79: When the relationship between two variables changes,<br>A)There