Multiple Choice
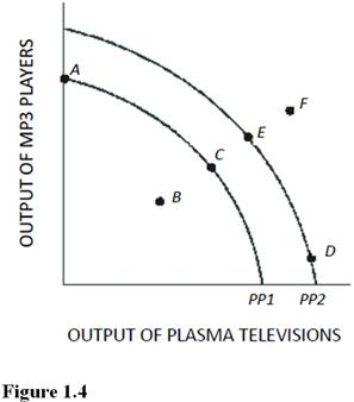 In Figure 1.4, a shift of the production possibilities curve from PP1 to PP2 could be caused by
A) An increase in the unemployment rate.
B) Implementation of training programs that improve the skills of workers.
C) A flu epidemic that makes many workers sick.
D) Tougher pollution controls for the producers of plasma televisions and MP3 players.
Correct Answer:

Verified
Correct Answer:
Verified
Q63: The market mechanism may best be defined
Q76: Explain the difference between macroeconomics and microeconomics.Give
Q98: Which of the following is true when
Q101: If an economy experiences constant opportunity costs
Q103: <img src="https://d2lvgg3v3hfg70.cloudfront.net/TB5718/.jpg" alt=" Refer to Figure
Q104: Opportunity cost is<br>A) Measured only in dollars
Q107: <img src="https://d2lvgg3v3hfg70.cloudfront.net/TB5718/.jpg" alt=" Refer to Figure
Q108: Table 1.1 shows the hypothetical trade-off
Q125: A line that slopes downward from left
Q134: Opportunity cost may be defined as the<br>A)Goods