Multiple Choice
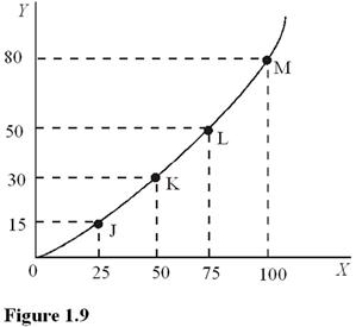 In Figure 1.9, the slope of the line between points K and L is
A) 1.25.
B) 0.80.
C) 0.75.
D) 0.60.
Correct Answer:

Verified
Correct Answer:
Verified
Related Questions
Q17: The "guns versus butter" dilemma that all
Q41: If an economy is producing inside the
Q46: The slope of a production possibilities curve
Q90: According to the law of increasing opportunity
Q103: Which of the following is the best
Q122: Macroeconomics focuses on the performance of<br>A) Individual
Q124: If market signals result in pollution beyond
Q126: Table 1.3 shows the hypothetical trade-off
Q131: Table 1.1 shows the hypothetical trade-off
Q132: In using a guns and butter production