Multiple Choice
A graph of class data is below.What is this type of graph called?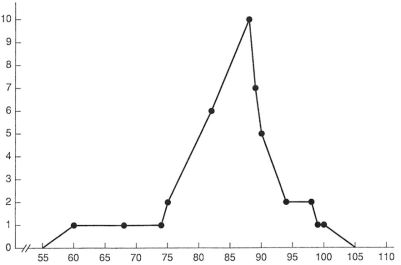
A) Frequency distribution
B) Normal distribution
C) Bell curve
D) Frequency polygon
Correct Answer:

Verified
Correct Answer:
Verified
Related Questions
Q9: Why is it necessary to understand the
Q29: The square root of the variance is
Q33: Variance is described as the degree or
Q36: Why should care be taken when interpreting
Q37: When students enroll in school and are
Q38: It is possible for the mean score
Q39: This scale's numbers are used for identification
Q40: A person who scores at the 85%tile
Q44: A person with an obtained IQ score
Q45: Using the data set below,answer the