Multiple Choice
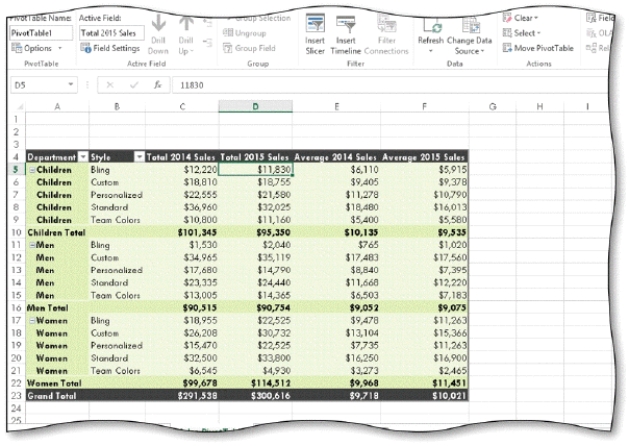
-You can filter the PivotTable report shown in the accompanying figure by ____.
A) Total 2014 Sales
B) Department and Style
C) Total 2015 Sales
D) Average 2014 Sales
Correct Answer:

Verified
Correct Answer:
Verified
Related Questions
Q102: A(n) _ report must always be associated
Q103: Some features of PivotTables and PivotCharts are
Q104: PivotTable fields can be one of three
Q105: MATCHING<br>Identify the letter of the choice that
Q106: By default, a PivotChart report will be
Q107: The +/- buttons _ a field across
Q109: To apply a sheet tab color, you
Q110: In a PivotTable, you use the filter
Q111: You can display the Move Chart dialog
Q112: MATCHING<br>Identify the letter of the choice that