Short Answer
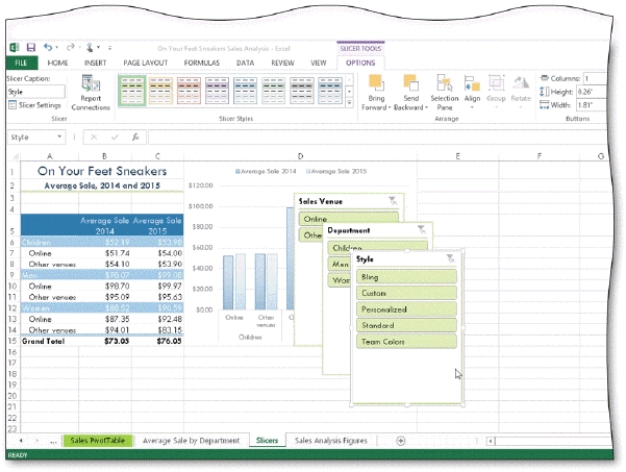
-As shown in the accompanying figure, _________________________ are graphic objects that contain buttons you tap or click to filter the data in PivotTables and PivotCharts.
Correct Answer:

Verified
Correct Answer:
Verified
Related Questions
Q53: Which are types of fields used by
Q54: Before you add a trendline to a
Q55: The default chart type for a PivotChart
Q56: MATCHING<br>Identify the letter of the choice that
Q57: Filtering cannot happen independently of cell selection.
Q59: The summary function that calculates the number
Q60: Excel needs the blank rows above a
Q61: To create a PivotChart report directly from
Q62: PivotChart reports often are used to represent
Q63: If you tap or click outside of