Multiple Choice
The graph below shows the total sales (in thousands of dollars) in a supermarket during a typical 24-hour period. 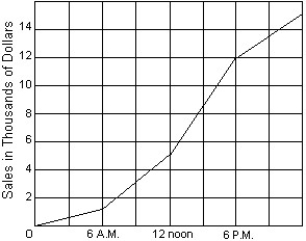 (i) Estimate the rate of sales during the period from 6 A.M. to 12 noon.
(ii) Which 6-hour interval sees the highest rate of sales and what is this rate?
A) (i) $167/hr
(ii) 6pm to 12 noon
B) (i) $1167/hr
(ii) noon to 6pm
C) (i) $667/hr
(ii) 12 noon to 6 pm $1167/hr.
D) none of these
Correct Answer:

Verified
Correct Answer:
Verified
Q5: Let f(x) = <span class="ql-formula"
Q6: Determine whether or not the following
Q7: Determine: <span class="ql-formula" data-value="\frac {
Q8: Find the equation of the following
Q9: A point P is moving along
Q11: Find the slope of the graph
Q12: <img src="https://d2lvgg3v3hfg70.cloudfront.net/TB3874/.jpg" alt=" -Q A) large
Q13: Find the second derivative of U
Q14: Calculate the following limit(s) if they
Q15: Find the derivative of f(x) =