Multiple Choice
Suppose that for selected years from 1970 to 2006, the following table shows the percent of total U.S. workers who are female. 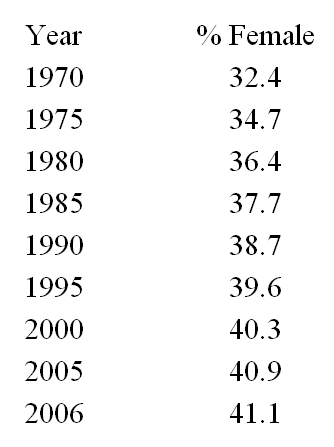
Assume these data can be modeled with the function 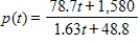 where p(t) is the percent of the U.S. workforce that is female and t is the number of years past 1970. Find the instantaneous rate of change in 2000 and 2006 by using the function that models the instantaneous rate of change of the percent of U.S. workers who are female. Round your answer to three decimal places.
A) 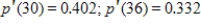
B) 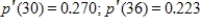
C) 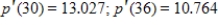
D) 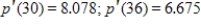
E) 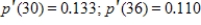
Correct Answer:

Verified
Correct Answer:
Verified
Q7: Find the derivative of the given function.
Q8: Find the derivative of the equation <img
Q9: This problem contains a function and its
Q10: Use the graph of <img src="https://d2lvgg3v3hfg70.cloudfront.net/TB4005/.jpg" alt="Use
Q11: Differentiate the given function. <img src="https://d2lvgg3v3hfg70.cloudfront.net/TB4005/.jpg"
Q13: Suppose the lowest temperature recorded in Indianapolis,
Q14: Find the derivative of the function.
Q15: For the function in this problem, approximate
Q16: The daily sales S (in thousands of
Q17: Find the derivative at the given x-value