Multiple Choice
The graph of a company's total cost function is shown. Will the 201st item or the 501st item cost more to produce? 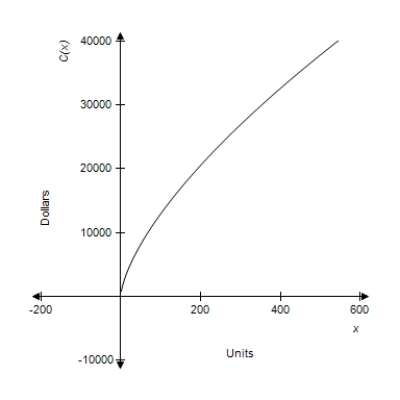
A) 201st
B) 501st
Correct Answer:

Verified
Correct Answer:
Verified
Related Questions
Q185: Find the indicated derivative and simplify.
Q186: If <img src="https://d2lvgg3v3hfg70.cloudfront.net/TB4005/.jpg" alt="If ,
Q187: Find the third derivative. <img src="https://d2lvgg3v3hfg70.cloudfront.net/TB4005/.jpg"
Q188: For the function given, find all x-values
Q189: Find the derivative of the given function.
Q191: In this problem, cost, revenue, and profit
Q192: If the formula describing the distance s
Q193: For the function in this problem, approximate
Q194: Use a table utility with x-values larger
Q195: The tangent line to the graph of