Multiple Choice
The graph of a company's total cost function is shown. Does this total cost function represent a manufacturing process that is getting more efficient or less efficient as the production level increases? 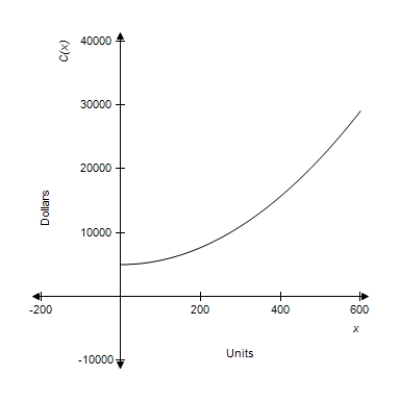
A) less efficient
B) more efficient
Correct Answer:

Verified
Correct Answer:
Verified
Q56: Use properties of limits and algebraic methods
Q57: The tangent line to the graph of
Q58: Find <img src="https://d2lvgg3v3hfg70.cloudfront.net/TB4005/.jpg" alt="Find
Q59: A certain calling card costs 5.2 cents
Q60: The amount of photosynthesis that takes place
Q62: If <img src="https://d2lvgg3v3hfg70.cloudfront.net/TB4005/.jpg" alt="If what
Q63: Find the second derivative of <img src="https://d2lvgg3v3hfg70.cloudfront.net/TB4005/.jpg"
Q64: Total revenue is in dollars and x
Q65: Suppose the revenue (in dollars) from the
Q66: Find the derivative of the given function.