Multiple Choice
The graphs of a company's total revenue function  and total cost function
  are shown. From the sale of 100 items, 500 items, and 700 items, rank from smallest to largest the amount of profit received.
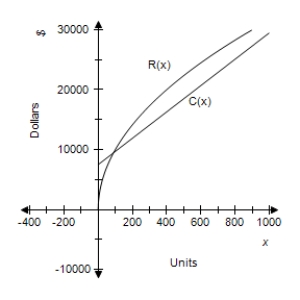
A) 
B) 
C) 
D) 
E) 
Correct Answer:

Verified
Correct Answer:
Verified
Q177: Find the derivative of the given function.
Q178: Complete the table and use it to
Q179: A graph of <img src="https://d2lvgg3v3hfg70.cloudfront.net/TB4005/.jpg" alt="A graph
Q180: Find the third derivative. <img src="https://d2lvgg3v3hfg70.cloudfront.net/TB4005/.jpg"
Q181: Differentiate the given function. <img src="https://d2lvgg3v3hfg70.cloudfront.net/TB4005/.jpg"
Q183: Suppose that the average number of minutes
Q184: For the given function, find the instantaneous
Q185: Find the indicated derivative and simplify.
Q186: If <img src="https://d2lvgg3v3hfg70.cloudfront.net/TB4005/.jpg" alt="If ,
Q187: Find the third derivative. <img src="https://d2lvgg3v3hfg70.cloudfront.net/TB4005/.jpg"