Multiple Choice
The graphs of a company's total revenue function  and total cost function
  are shown. The cost function is a linear function of the number of units sold. From the sale of the 51st item, 401st item, and 701st item, rank from smallest to largest the amount of profit received.
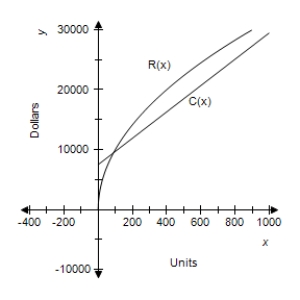
A) 701st, 51st, 401st
B) 401st, 701st, 51st
C) 701st, 401st, 51st
D) 51st, 701st, 401st
E) 51st, 401st, 701st
Correct Answer:

Verified
Correct Answer:
Verified
Q20: If <img src="https://d2lvgg3v3hfg70.cloudfront.net/TB4005/.jpg" alt="If and
Q21: Suppose the total revenue function for a
Q22: Suppose that the total cost function, in
Q23: For the function in this problem, find
Q24: If the profit function for a product
Q26: For the function in this problem, find
Q27: Find the indicated derivative. <img src="https://d2lvgg3v3hfg70.cloudfront.net/TB4005/.jpg"
Q28: The graph of a company's profit function
Q29: Differentiate the given function. <img src="https://d2lvgg3v3hfg70.cloudfront.net/TB4005/.jpg"
Q30: A graph of <img src="https://d2lvgg3v3hfg70.cloudfront.net/TB4005/.jpg" alt="A graph