Multiple Choice
Which list of data is displayed in this frequency histogram? 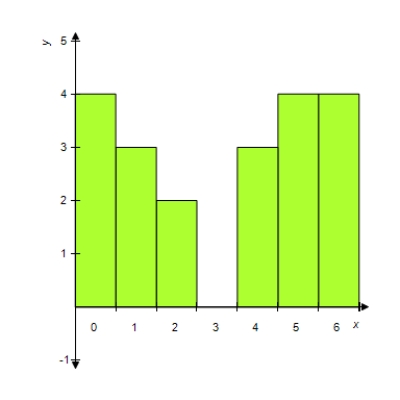
A) 0, 0, 0, 0, 0, 1, 1, 2, 2, 4, 4, 5, 5, 5, 5
B) 1, 1, 1, 1, 2, 2, 2, 3, 4, 5, 5, 5, 5
C) 0, 1, 2, 3, 3, 3, 3, 3, 5, 5, 5, 5, 6, 6
D) 0, 0, 0, 2, 2, 4, 4, 4, 5, 5, 5, 5, 6, 6, 6, 6, 6
E) 0, 0, 0, 0, 1, 1, 1, 2, 2, 4, 4, 4, 5, 5, 5, 5, 6, 6, 6, 6
Correct Answer:

Verified
Correct Answer:
Verified
Q2: In a binomial experiment, find the probability
Q3: In a binomial experiment, find the probability
Q4: Suppose a population of scores x is
Q7: A coin is "loaded" so that the
Q8: A candidate claims that 60% of the
Q9: A die is rolled 2 times, and
Q10: Suppose an experiment has five possible outcomes
Q36: The mean weight of a group of
Q66: Find the median of the set of
Q98: Forty-nine percent of accountants taking a CPA