Multiple Choice
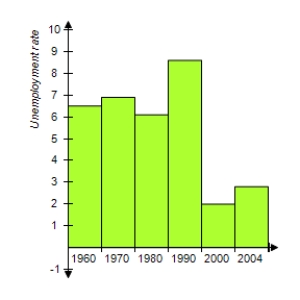
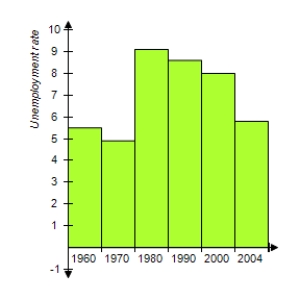
The following table gives a city's unemployment rates for civilian workers for selected years from 1960 to 2004. Which bar graph represents the information given in the table? 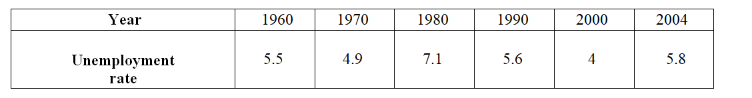
A)
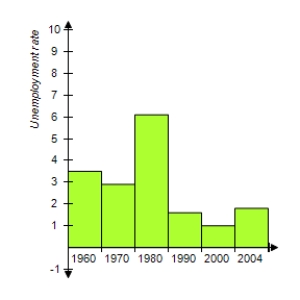
B)
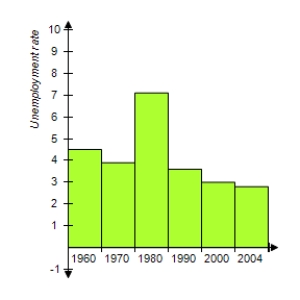
C)
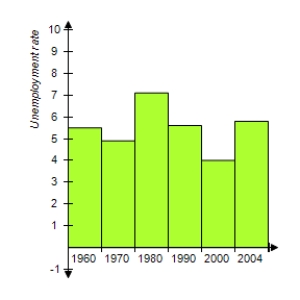
D)
E)
Correct Answer:

Verified
Correct Answer:
Verified
Related Questions
Q7: If a fair coin is tossed 123
Q18: Suppose the probability that a certain drug
Q27: Find the median of the set of
Q43: Find the standard deviation of the sample
Q45: The percents of total households that contain
Q48: Suppose a pair of dice is thrown
Q48: Suppose a population of scores x is
Q73: Suppose that the ratio of boys born
Q80: Find the range of the set of
Q95: A company produces shotgun shells in batches