Multiple Choice
The following bar graph shows the size of the average farm (in acres) for selected years from 1940 to 2000. Which table shows the data displayed in the graph? 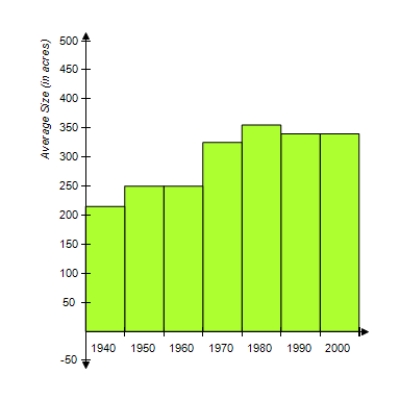
A) 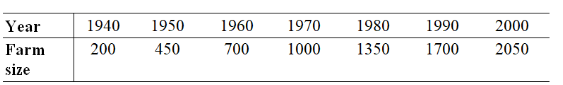
B) 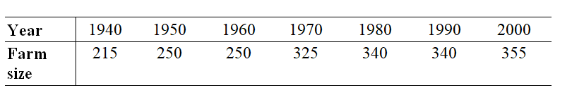
C) 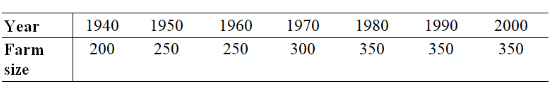
D) 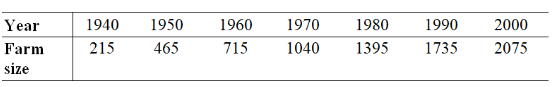
E) 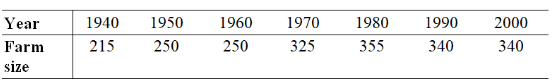
Correct Answer:

Verified
Correct Answer:
Verified
Related Questions
Q12: In a certain school district, 23% of
Q34: A baseball player has a lifetime batting
Q53: Find the mode of the set of
Q81: If the probability of success on each
Q82: Determine c, if possible, so that the
Q85: If the probability that a newborn child
Q87: Suppose it has been determined empirically that
Q91: Suppose a population of scores x is
Q96: Suppose the Circuitown buys plasma televisions in
Q110: If a die is rolled 113 times,