Multiple Choice
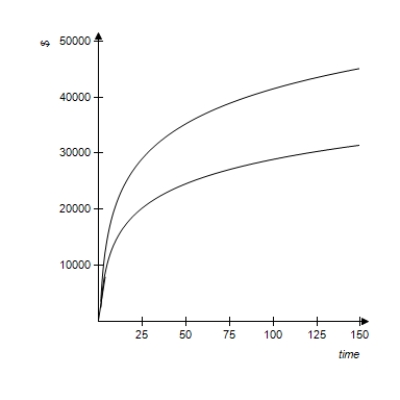
The following figure shows a graph that compares the present values of two ordinary annuities of $800 quarterly as functions of the number of quarters. One annuity is at an annual rate of 6% compounded quarterly, and the other is at 9% compounded quarterly. What present value is required to purchase an annuity of $800 a quarter for 25 years with an interest rate of 9% compounded quarterly? Check your answer against the graph. Round your answer to the nearest cent.
A) $31,713.39
B) $40,146.91
C) $27,577.08
D) $39,107.20
E) $52,000.00
Correct Answer:

Verified
Correct Answer:
Verified
Q4: A small business owner contributes $5,000 at
Q7: During four years of college, Nolan MacGregor's
Q9: Gail Kelley deposits $600 in an account
Q10: What does the number 0.06 represent in
Q11: Suppose you are offered a job paying
Q30: A developer wants to buy a certain
Q81: A debt of $8,800 is to be
Q115: Find the future value of an annuity
Q116: To help their son buy a car
Q121: Decide whether the problem relates to an