Multiple Choice
Let  . Use a graphing utility to graph the functions
  and
and  where
where  . Identify the graphs of
  and
and  below.
A) 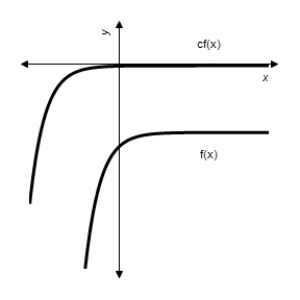
B) 
C) 
D) 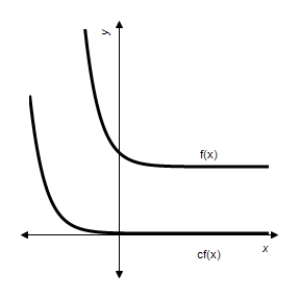
E) 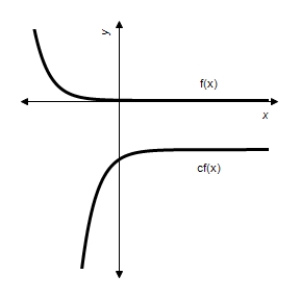
Correct Answer:

Verified
Correct Answer:
Verified
Related Questions
Q53: If $7,000 is invested at an annual
Q54: Solve for x by writing the equation
Q55: Solve for x by writing the equation
Q56: A starfish population can be modeled by
Q57: For selected years from 1978 to 2002,
Q59: Use the formula <img src="https://d2lvgg3v3hfg70.cloudfront.net/TB4005/.jpg" alt="Use the
Q60: Use a calculator to evaluate the expression.
Q61: The president of a company predicts that
Q62: The following figure, from Investor's Business Daily
Q63: Solve the logarithmic equation <img src="https://d2lvgg3v3hfg70.cloudfront.net/TB4005/.jpg" alt="Solve