Multiple Choice
The amount of money invested in a certain mutual funds, measured in millions of dollars, for the years 1995 to 1999 was found to be modeled by 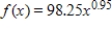 million dollars, where x is the number of years past 1990. Will the graph of this function bend upward or will it bend downward? How much money is predicted to be in the fund in the year 2009? Round your answer to two decimal places.
A) the function's graph bends upward; the function predicts 134,947.08 million dollars in 2009
B) the function's graph bends downward; the function predicts 134,947.08 million dollars in 2009
C) the function's graph bends upward; the function predicts 68,279.14 million dollars in 2009
D) the function's graph bends downward; the function predicts 1,611.20 million dollars in 2009
E) the function's graph bends upward; the function predicts 1,611.20 million dollars in 2009
Correct Answer:

Verified
Correct Answer:
Verified
Q90: Find the maximum revenue for the revenue
Q91: Determine whether the given graph is the
Q92: If the profit from the sale of
Q93: If the supply function for a commodity
Q94: If a firm has the following cost
Q96: A ball thrown vertically into the air
Q97: The table shows the average earnings of
Q98: Sketch the graph of the function <img
Q99: Write the equation <img src="https://d2lvgg3v3hfg70.cloudfront.net/TB4005/.jpg" alt="Write the
Q100: Form the profit function for the cost