Multiple Choice
Suppose the IQ scores (rounded to the nearest 10) for a group of people are summarized in the table below. Find the quadratic function that best fits the data, using x as the IQ score and y as the number of people in the group with that IQ score. Use a graphing utility to estimate the IQ score of the maximum number of individuals according to the model. Round your final answer to 2 decimal places. 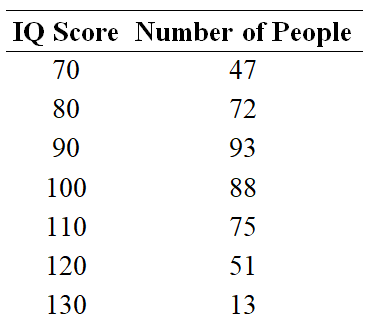
A)  The model predicts that the maximum number of people have an IQ score of approximately 96.
B)  The model predicts that the maximum number of people have an IQ score of approximately 90.
C)  The model predicts that the maximum number of people have an IQ score of approximately 90.
D)  The model predicts that the maximum number of people have an IQ score of approximately 96.
E)  The model predicts that the maximum number of people have an IQ score of approximately 90.
Correct Answer:

Verified
Correct Answer:
Verified
Q43: Find the vertex and then determine the
Q44: If, in a monopoly market, the demand
Q45: Suppose that the cost C (in dollars)
Q46: The amount of airborne particulate pollution p
Q47: A supply function has the equation is
Q49: Graph the power function that models the
Q50: Find the average rate of change of
Q51: Solve the equation by using a graphing
Q52: The table gives the percent of the
Q53: Determine what type of function best models