Multiple Choice
Suppose that the following table shows the number of millions of people in the United States who lived below the poverty level for selected years. Find a cubic model that approximately fits the data, using x as the number of years after 1960. Round numerical values in your answer to four decimal places. Depending on the technology you use, your answer may be slightly different than the correct answer shown. 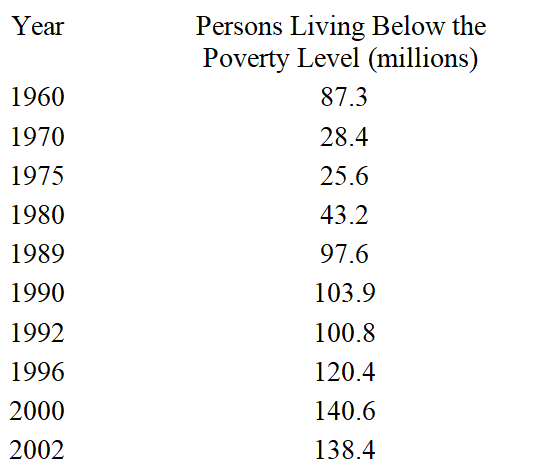
A) 
B) 
C) 
D) 
E) 
Correct Answer:

Verified
Correct Answer:
Verified
Q53: Determine what type of function best models
Q54: If the supply and demand functions for
Q55: The sensitivity S to a drug is
Q56: The table gives the median household income
Q57: Determine if the vertex of the graph
Q59: Assume that costs and expenses for Continental
Q60: The yield in bushels from a grove
Q61: Graph the quadratic function that models the
Q62: Solve <img src="https://d2lvgg3v3hfg70.cloudfront.net/TB4005/.jpg" alt="Solve for
Q63: Solve the equation <img src="https://d2lvgg3v3hfg70.cloudfront.net/TB4005/.jpg" alt="Solve the