Multiple Choice
Suppose the following table gives the U.S. population, in millions, for selected years, with projections to 2050. Find a linear model that approximately fits the data, with x equal to the number of years past 1960. Round numerical values in your answer to three decimal places. Depending on the technology you use, your answer may be slightly different than the correct answer shown. 
A) 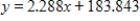
B) 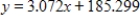
C) 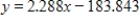
D) 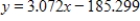
E) 
Correct Answer:

Verified
Correct Answer:
Verified
Q72: Assume that sales revenues for Continental Divide
Q73: Graph the linear function that models the
Q74: Determine whether the function's vertex is a
Q75: The demand function for a product is
Q76: Determine whether the scatter plot should be
Q78: Find the equation of the cubic function
Q79: Find the vertex of the graph of
Q80: Use a graphing utility to approximate the
Q81: Find the x-intercepts, if any exist. Round
Q82: The table below shows the national expenditures