Multiple Choice
Choose the graph that represents the equation below.

A) 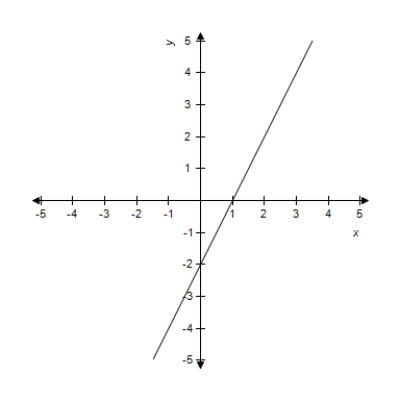
B) 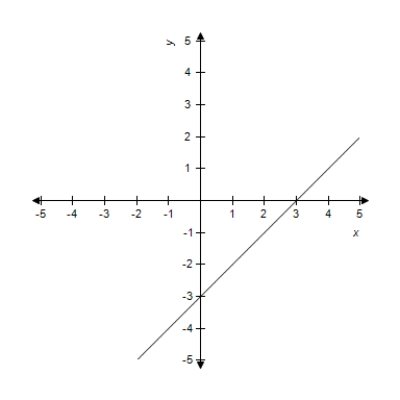
C) 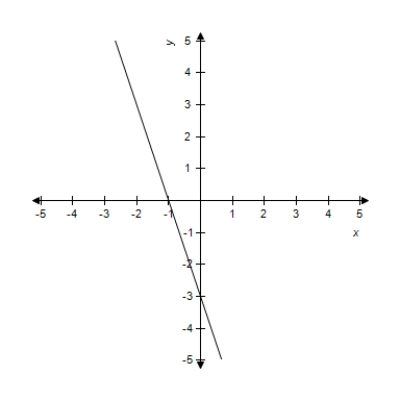
D) 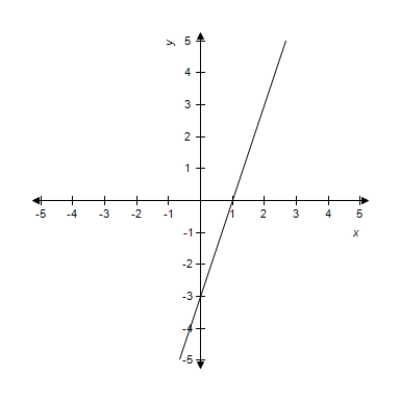
E) 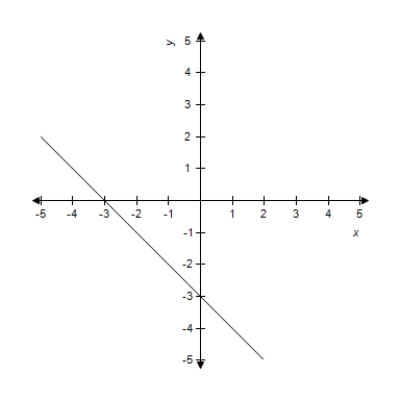
Correct Answer:

Verified
Correct Answer:
Verified
Related Questions
Q226: The percent p of high school seniors
Q227: A manufacturer sells watches for $75 per
Q228: A manufacturer sells watches for $60 per
Q229: When a debt is refinanced, sometimes the
Q230: Burnem, Inc. manufactures blank CDs and sells
Q232: Solve <img src="https://d2lvgg3v3hfg70.cloudfront.net/TB4005/.jpg" alt="Solve for
Q233: The figure below show the demand and
Q234: Each day, a young person should sleep
Q235: Graph the equation with a graphing utility
Q236: The graphs of the two equations below