True/False
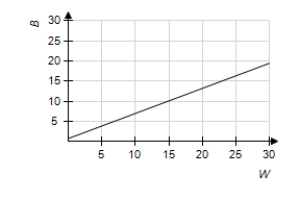
With U.S. Census Bureau data, the model that relates the per capita annual income (in thousands of dollars) of blacks B and whites W was found to be 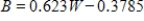 . Use a graphing utility to graph this equation for the range W-min = 0, W-max = 30; B-min = 0, B-max = 30. Is the image below the correct graph of the function?
Correct Answer:

Verified
Correct Answer:
Verified
Q93: Graph the function using a window that
Q94: Use a graphing utility with the standard
Q95: Retailers will buy 45 cordless phones from
Q96: Suppose a stereo receiver manufacturer has the
Q97: Complete the problem by using your calculator.
Q99: For a certain product, the revenue function
Q100: In Sweetwater, Arizona, water bills are taxed
Q101: Solve the inequality. <img src="https://d2lvgg3v3hfg70.cloudfront.net/TB4005/.jpg" alt="Solve
Q102: The retirement plan for Pennsylvania state employees
Q103: The equation in this problem leads to