Multiple Choice
The number (in millions) of U.S. cellular telephone subscribers can be described by 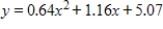 , where x is the number of years past 1990. For years beyond 2010, does this graph increase or decrease? (Look at this graph in a window that includes these years.)
A) increases
B) decreases
Correct Answer:

Verified
Correct Answer:
Verified
Q118: For <img src="https://d2lvgg3v3hfg70.cloudfront.net/TB4005/.jpg" alt="For and
Q119: If <img src="https://d2lvgg3v3hfg70.cloudfront.net/TB4005/.jpg" alt="If ,
Q120: Write the equation and graph the line
Q121: Solve the system of equations by substitution.
Q122: In the United States between 1970 and
Q124: Determine whether the following pairs of equations
Q125: The graph of <img src="https://d2lvgg3v3hfg70.cloudfront.net/TB4005/.jpg" alt="The graph
Q126: It has been estimated that a certain
Q127: Use a graphing utility with the standard
Q128: If 140 feet of fence is to