Multiple Choice
The figure below is the graph of both the demand function D and the supply function S for the same product, where P is the price per unit and Q is the number of units produced. Will there be a market surplus or shortage when the price P is $150? 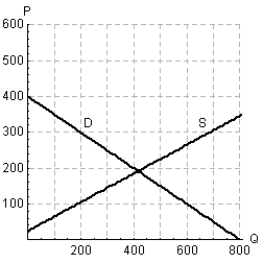
A) There will be a market surplus.
B) There will be a market shortage.
Correct Answer:

Verified
Correct Answer:
Verified
Q75: Solve the system of equations by substitution.
Q76: Choose the graph that represents the equation
Q77: Solve the system of equations by using
Q78: A shoe store owner will buy 10
Q79: A woman has $289,000 invested in two
Q81: Write the equation and graph the line
Q82: The height above ground, S (in feet),
Q83: A function and its graph are given.
Q84: Is the relation defined by the table
Q85: Suppose that the consumer expenditure E (in