Multiple Choice
Suppose that the data in the table below shows the average earnings of year-round full-time workers by gender for several different levels of educational attainment. Find and interpret the slope of the linear regression line. Round the slope to three decimal places. 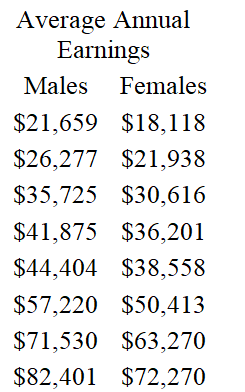
A) The slope is 0.910. The average annual earnings of females is decreasing at a rate of $0.910 per dollar increase in the annual of males.
B) The slope is 0.807. The average annual earnings of females is decreasing at a rate of $0.807 per dollar decrease in the average annual earnings of males.
C) The slope is 0.759. The average annual earnings of females is decreasing at a rate of $0.759 per dollar decrease in the average annual earnings of males.
D) The slope is 0.900. The average annual earnings of females is increasing at a rate of $0.900 per dollar increase in the average annual earnings of males.
E) The slope is 0.749. The average annual earnings of females is increasing at a rate of $0.749 per dollar increase in the average annual earnings of males.
Correct Answer:

Verified
Correct Answer:
Verified
Q53: If <img src="https://d2lvgg3v3hfg70.cloudfront.net/TB4005/.jpg" alt="If ,
Q54: Suppose that the joint cost (in dollars)
Q55: If <img src="https://d2lvgg3v3hfg70.cloudfront.net/TB4005/.jpg" alt="If ,
Q56: If <img src="https://d2lvgg3v3hfg70.cloudfront.net/TB4005/.jpg" alt="If ,
Q57: Use the function <img src="https://d2lvgg3v3hfg70.cloudfront.net/TB4005/.jpg" alt="Use the
Q59: In economics, the most economical quantity Q
Q60: Suppose that the utility function for two
Q61: Test for relative maximum and minimum.
Q62: If <img src="https://d2lvgg3v3hfg70.cloudfront.net/TB4005/.jpg" alt="If ,
Q63: Find the maximum value of <img src="https://d2lvgg3v3hfg70.cloudfront.net/TB4005/.jpg"