Multiple Choice
The following table gives the actual or projected population in millions for a certain city for selected years from 2000 to 2050. Use linear regression to find the linear equation that is the best fit for the data, with x equal to the number of years past 2000. 
A) 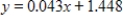
B) 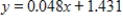
C) 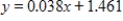
D) 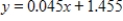
E) 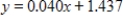
Correct Answer:

Verified
Correct Answer:
Verified
Q46: The total cost (in dollars) of producing
Q47: Find the maximum value of the function
Q48: Dr. Paul Siple conducted studies testing the
Q49: The cost per day to society of
Q50: Give the domain of the function <img
Q52: Use the function <img src="https://d2lvgg3v3hfg70.cloudfront.net/TB4005/.jpg" alt="Use the
Q53: If <img src="https://d2lvgg3v3hfg70.cloudfront.net/TB4005/.jpg" alt="If ,
Q54: Suppose that the joint cost (in dollars)
Q55: If <img src="https://d2lvgg3v3hfg70.cloudfront.net/TB4005/.jpg" alt="If ,
Q56: If <img src="https://d2lvgg3v3hfg70.cloudfront.net/TB4005/.jpg" alt="If ,