Multiple Choice
The graph in the following figure gives the times that it takes a vehicle to reach speeds from 0 mph to 25 mph, in increments of 5 mph, with a curve connecting them. Count the squares under the curve to estimate this distance. Estimate the distance traveled by the vehicle in 14 seconds, to a speed of 25 mph. (Be careful with time units.) 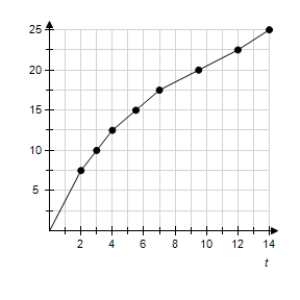
A) 1/16 mile
B) 4/15 mile
C) 1/13 mile
D) 1/9 mile
E) 1/8 mile
Correct Answer:

Verified
Correct Answer:
Verified
Q343: In a manufacturing process involving several machines,
Q344: Use Simpson's Rule to approximate <img src="https://d2lvgg3v3hfg70.cloudfront.net/TB4005/.jpg"
Q345: Find the average value of the given
Q346: Use an integral formula to evaluate <img
Q347: Find the area of the shaded region.
Q349: Suppose the following table gives the supply
Q350: Use an integral formula to evaluate <img
Q351: If the demand function for wheat is
Q352: Evaluate the definite integral <img src="https://d2lvgg3v3hfg70.cloudfront.net/TB4005/.jpg" alt="Evaluate
Q353: Evaluate the integral <img src="https://d2lvgg3v3hfg70.cloudfront.net/TB4005/.jpg" alt="Evaluate the