Multiple Choice
The graph in the following figure gives the times that it takes a vehicle to reach speeds from 0 mph to 25 mph, in increments of 5 mph, with a curve connecting them. Count the squares under the curve to estimate this distance. Estimate the distance traveled by the vehicle in 14 seconds, to a speed of 25 mph. (Be careful with time units.) 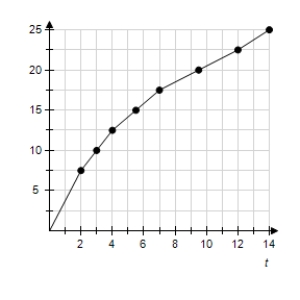
A) 1/16 mile
B) 4/15 mile
C) 1/13 mile
D) 1/9 mile
E) 1/8 mile
Correct Answer:

Verified
Correct Answer:
Verified
Q80: If the demand function for a product
Q81: Evaluate the integral <img src="https://d2lvgg3v3hfg70.cloudfront.net/TB4005/.jpg" alt="Evaluate the
Q82: With data for 1990 to 2002, the
Q83: The Lorenz curve for the income distribution
Q84: Use an integral formula to evaluate <img
Q86: Evaluate the improper integral if it converges,
Q87: Find the value of the sum <img
Q88: Use the function <img src="https://d2lvgg3v3hfg70.cloudfront.net/TB4005/.jpg" alt="Use the
Q89: The probability density function for the life
Q90: Use integration by parts to evaluate <img