Multiple Choice
Use the graph shown in the figure and identify points from A through I that satisfy the given condition.  and
and 
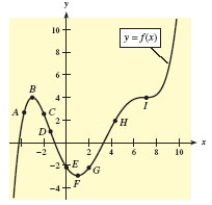
A) B
B) D
C) C
D) F
E) G
Correct Answer:

Verified
Correct Answer:
Verified
Related Questions
Q154: Suppose that the total number of units
Q155: Find any vertical asymptotes for the given
Q156: Analytically determine the location(s) of any horizontal
Q157: Find all relative maxima of the given
Q158: For the given function, find all intervals
Q160: A function and its graph are given.
Q161: A function and its graph are given.
Q162: Use the derivative to locate all critical
Q163: For the given function and graph, determine
Q164: The owner of an orange grove must