Multiple Choice
The following figure shows the growth of a population as a function of time. 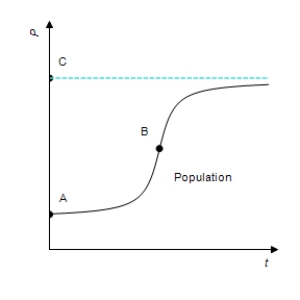 Which of A, B, and C correspond(s) to the point(s) at which the growth rate attains its maximum?
A) B
B) A
C) C
D) A and C
E) none of the above
Correct Answer:

Verified
Correct Answer:
Verified
Related Questions
Q49: Suppose that the monthly cost in dollars
Q50: A ball thrown into the air from
Q51: In this problem, <img src="https://d2lvgg3v3hfg70.cloudfront.net/TB4005/.jpg" alt="In this
Q52: Both a function and its derivative are
Q53: A function and its graph are given.
Q55: If the total cost function for a
Q56: Assume that the total daily cost, in
Q57: A travel agency will plan a tour
Q58: Suppose that the oxygen level P (for
Q59: For the given function and graph, estimate