Multiple Choice
The following figure shows the growth of a population as a function of time. 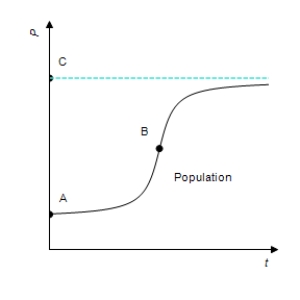 Which of A, B, and/or C correspond(s) to the upper limit of population?
A) B
B) C
C) A
D) B and A
E) none of the above
Correct Answer:

Verified
Correct Answer:
Verified
Related Questions
Q97: Both a function and its derivative are
Q98: Suppose the average costs of a mining
Q99: A firm has total revenue given by
Q100: For the given function, find the relative
Q101: A product can be produced at a
Q103: A function and its first and second
Q104: A function and its first and second
Q105: Analytically determine any relative maxima. Round your
Q106: The consumer price data can be modeled
Q107: The profit function for a commodity is