Multiple Choice
The following figure shows the graph of revenue function  and cost function
  . At which of the four x-values shown is the profit largest?
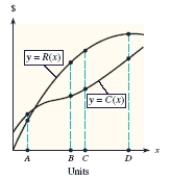
A) A
B) C
C) B
D) D
E) Profit is largest at more than one x-value.
Correct Answer:

Verified
Correct Answer:
Verified
Related Questions
Q118: The millions of worldwide cellular subscribers can
Q119: Both a function and its derivative are
Q120: A kennel of 750 square feet is
Q121: A function and its graph are given.
Q122: A rectangular box with a square base
Q124: Use the graph shown in the figure
Q125: The running yard for a dog kennel
Q126: Suppose that in an election year, the
Q127: An inferior product with a large advertising
Q128: A function and its graph are given.