Multiple Choice
The following figure shows the graph of revenue function  and cost function
  . At which of the four x-values shown is the slope of the tangent to the revenue curve equal to the slope of the tangent to the cost curve?
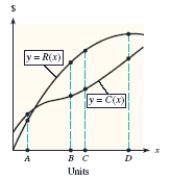
A) D
B) B
C) C
D) A
E) profit largest at more than one x-value
Correct Answer:

Verified
Correct Answer:
Verified
Q162: Use the derivative to locate all critical
Q163: For the given function and graph, determine
Q164: The owner of an orange grove must
Q165: A function and its first and second
Q166: A firm can produce 100 units per
Q168: A graph of <img src="https://d2lvgg3v3hfg70.cloudfront.net/TB4005/.jpg" alt="A graph
Q169: A function and its graph are given.
Q170: A function and its first and second
Q171: Find any vertical asymptotes for the given
Q172: Find any horizontal asymptotes for the given