Multiple Choice
Choose the inequality that describes the graph below. 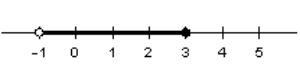
A) 
B) 
C) 
D) 
E) 
Correct Answer:

Verified
Correct Answer:
Verified
Related Questions
Q5: Choose the correct interval notation for this
Q6: From data adapted from the National Center
Q7: Choose the correct interval notation for this
Q8: Choose the graph that represents this subset
Q9: Write the following set a second way.
Q11: Assume that <img src="https://d2lvgg3v3hfg70.cloudfront.net/TB4005/.jpg" alt="Assume that
Q12: Based on data adapted from the National
Q13: Use your calculator to approximate the following
Q14: If and , is A a subset
Q15: Express the graph below using interval notation.