Multiple Choice
An object is moving in a straight line along the x-axis. A plot of its velocity in the x direction as a function of time is shown in the figure. Which graph represents its acceleration in the x direction as a function of time? 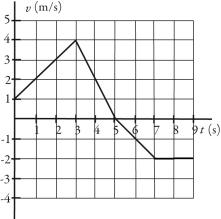
A) 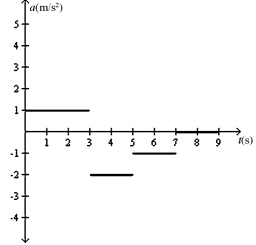
B) 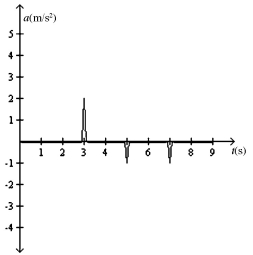
C) 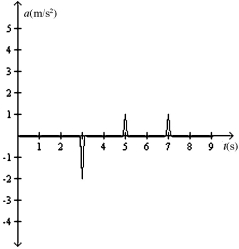
D) 
E) 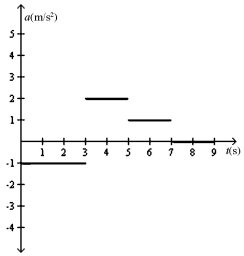
Correct Answer:

Verified
Correct Answer:
Verified
Related Questions
Q12: A soccer ball is released from rest
Q14: An object is moving with constant non-zero
Q15: The acceleration of an object as a
Q17: Two identical objects A and B fall
Q18: An airplane that is flying level needs
Q19: The velocity of an object as a
Q21: The figure shows the position of an
Q22: The motions of a car and a
Q23: The figure shows the position of an
Q24: A car accelerates from 10.0 m/s to