Multiple Choice
An object starts its motion with a constant velocity of 2.0 m/s toward the east. After 3.0 s, the object stops for 1.0 s. The object then moves toward the west a distance of 2.0 m in 3.0 s. The object continues traveling in the same direction, but increases its speed by 1.0 m/s for the next 2.0 s. Which graph below could represent the motion of this object?
A) 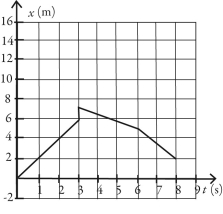
B) 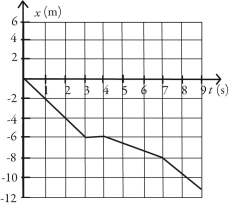
C) 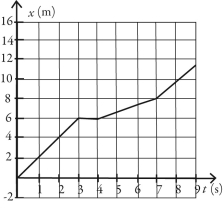
D) 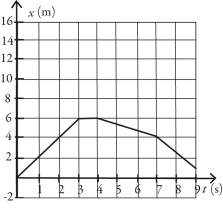
Correct Answer:

Verified
Correct Answer:
Verified
Q8: A rocket takes off vertically from the
Q9: The figure shows the position of an
Q10: Two objects are thrown from the top
Q12: Arthur and Betty start walking toward each
Q12: A soccer ball is released from rest
Q14: A ball is projected upward at time
Q15: The acceleration of an object as a
Q17: Two identical objects A and B fall
Q18: An airplane that is flying level needs
Q24: To determine the height of a flagpole,Abby