Multiple Choice
A graph of the force on an object as a function of its position is shown in the figure. Determine the amount of work done by this force on an object that moves from x = 1.0 m to x = 6.0 m. (Assume an accuracy of 2 significant figures for the numbers on the graph.) 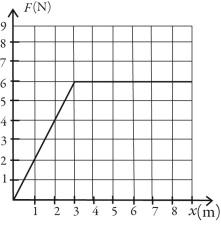
A) 26 J
B) 29 J
C) 22 J
D) 35 J
E) 27 J
Correct Answer:

Verified
Correct Answer:
Verified
Q9: If a force always acts perpendicular to
Q12: Consider a plot of the displacement (x)as
Q12: Three forces, F<sub>1</sub> = 20.0 N, F<sub>2</sub>
Q13: A 1000 kg car experiences a net
Q14: Two objects, one of mass m and
Q17: In the figure, two identical springs have
Q18: An object attached to an ideal massless
Q20: A 4.0-kg object is moving with speed
Q21: In the figure, two boxes, each of
Q28: A 5.00-kg box slides 4.00 m across