Multiple Choice
The process shown in the pV diagram in the figure is an 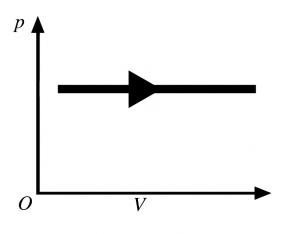
A) adiabatic expansion.
B) isothermal expansion.
C) isochoric expansion.
D) isobaric expansion.
E) isochoric compression.
Correct Answer:

Verified
Correct Answer:
Verified
Related Questions
Q14: During an isothermal process,5.0 J of heat
Q19: In a thermodynamic process involving 7.8 moles
Q20: A fixed amount of ideal gas goes
Q21: The temperature of an ideal gas in
Q22: The temperature of an ideal gas in
Q25: A monatomic ideal gas undergoes an isothermal
Q29: A compression, at a constant pressure of
Q46: A steel container,equipped with a piston,contains 21
Q49: In an isochoric process,the internal (thermal)energy of
Q51: When a fixed amount of ideal gas