Multiple Choice
You make a phospholipid bilayer with short, saturated hydrocarbon tails. You measure the permeability of this membrane to oxygen. You then double the length of the hydrocarbon tails and remeasure membrane permeability. You then double the length of the hydrocarbon tails again and make a third measurement of membrane permeability. You graph membrane permeability as a function of hydrocarbon tail length. Which of the accompanying graphs best represents the data you expect?
A) 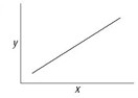
B) 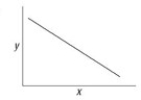
C) 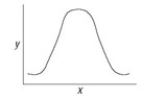
D) 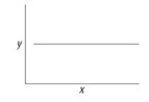
Correct Answer:

Verified
Correct Answer:
Verified
Q1: Five dialysis bags, constructed from a semipermeable
Q28: Celery stalks that are immersed in freshwater
Q29: Which of the following affects the osmolarity
Q30: You have just discovered an organism that
Q31: Five dialysis bags constructed of membrane, which
Q32: Refer to the following paragraph and accompanying
Q35: What is the most important factor in
Q36: Which of the following is most likely
Q36: Which of the following types of molecules
Q37: Which aspect of phospholipids is most important