Multiple Choice
You make a phospholipid bilayer with short, saturated hydrocarbon tails. You measure the permeability of this membrane to oxygen. You are going to change the length of the hydrocarbon tails and remeasure membrane permeability, but first your boss asks you to graph the data you expect if there is no effect of hydrocarbon tail length on membrane permeability (your null hypothesis) . Which of the accompanying graphs best represents the data you expect if your null hypothesis is correct?
A) 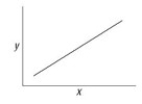
B) 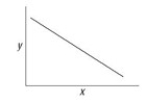
C) 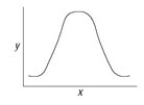
D) 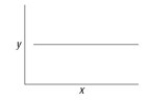
Correct Answer:

Verified
Correct Answer:
Verified
Q2: Lipids _.<br>A) are insoluble in water<br>B) are
Q4: The solutions in the arms of a
Q5: Ions diffuse across membranes through specific ion
Q8: Steroid hormones are large communication molecules that
Q9: Use the following information when answering the
Q10: In some cells, there are many ion
Q11: Which of the following crosses lipid bilayers
Q12: Which of the following crosses lipid bilayers
Q62: In what way do the membranes of
Q70: Glucose diffuses slowly through artificial phospholipid bilayers.