Short Answer
The following graphical breakeven analysis is for Nicronea's new line of desktop computers. Questions related to the graph should be answered in the spaces provided.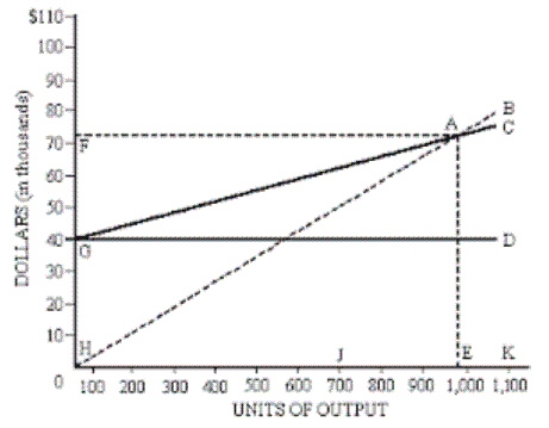
a. Production at point J would be at a __________.
b. The area depicting profitable operations is __________.
c. The fixed costs area is within letters __________.
d. The total revenue area is within letters ___________.
e. The breakeven point for sales units is at letter __________.
f. Letter A represents __________.
g. The line H-B represents what C-V-P element? ___________.
h. Total cost of operations is reflected in line __________.
Correct Answer:

Verified
a. loss
b. B - A - C
c. D, G, ...View Answer
Unlock this answer now
Get Access to more Verified Answers free of charge
Correct Answer:
Verified
b. B - A - C
c. D, G, ...
View Answer
Unlock this answer now
Get Access to more Verified Answers free of charge
Q35: Breakeven analysis adjusted for a profit factor<br>A)
Q58: Identify the following activities, for an automobile
Q62: Identify the following activities, for an automobile
Q82: Excerpts from a cost-volume-profit analysis indicate fixed
Q84: Theoretical operating capacity is the level at
Q101: In breakeven analysis adjusted for a profit
Q113: A scatter diagram helps to determine if
Q134: Cost behavior is the way prices are
Q139: SHARE is trying to determine how many
Q158: Explain what cost-volume-profit analysis is and how