Multiple Choice
In the below graph, which shows the relationship among components of quality cost, Line "B" depicts: 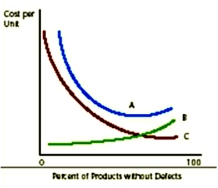
A) total quality costs.
B) external failure quality cost.
C) voluntary quality costs.
D) internal failure quality costs.
Correct Answer:

Verified
Correct Answer:
Verified
Related Questions
Q11: The number of activity cost centers used
Q44: Which of the following is an example
Q56: The term "quality" refers to the degree
Q58: How would a company determine the optimal
Q104: Which of the following is the most
Q136: What is the basic premise behind activity-based
Q139: Most companies allocate facility-level activity costs directly
Q140: Actions or units of work undertaken by
Q147: Select the term from the list provided
Q153: Indicate whether each of the following statements