menu-iconExamlexExamLexServices

Discover

Ask a Question
  1. All Topics
  2. Topic
    Business
  3. Study Set
    Fundamental Managerial Accounting Concepts Study Set 2
  4. Exam
    Exam 5: Cost Management in an Automated Business Environment: Abc, Abm, and Tqm
  5. Question
    In the Below Graph, Which Shows the Relationship Among Components
Solved

In the Below Graph, Which Shows the Relationship Among Components

Question 92

Question 92

Multiple Choice

In the below graph, which shows the relationship among components of quality cost, Line "C" depicts:
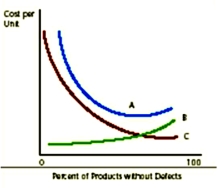
 In the below graph, which shows the relationship among components of quality cost, Line  C  depicts:   A) failure costs. B) internal quality cost. C) voluntary quality failure costs. D) prevention costs.


A) failure costs.
B) internal quality cost.
C) voluntary quality failure costs.
D) prevention costs.

Correct Answer:

verifed

Verified

Unlock this answer now
Get Access to more Verified Answers free of charge

Related Questions

Q10: Total quality control cost is the sum

Q42: Miller Company makes two types of chairs.One

Q59: Indicate whether each of the following statements

Q60: One of the advantages of activity-based costing

Q70: Which of the following activity costs should

Q95: Ballantine Company manufactures two products. Currently,

Q115: All of the following are internal failure

Q116: Activity-based costing does not use volume-based cost

Q134: Which of the following costs is the

Q144: Indicate whether each of the following statements

Examlex

ExamLex

About UsContact UsPerks CenterHomeschoolingTest Prep

Work With Us

Campus RepresentativeInfluencers

Links

FaqPricingChrome Extension

Download The App

Get App StoreGet Google Play

Policies

Privacy PolicyTerms of ServiceHonor CodeCommunity Guidelines

Scan To Download

qr-code

Copyright © (2025) ExamLex LLC.

Privacy PolicyTerms Of ServiceHonor CodeCommunity Guidelines