Multiple Choice
Consider the following cost-volume-profit graph: What is the approximate amount of fixed costs in this organization?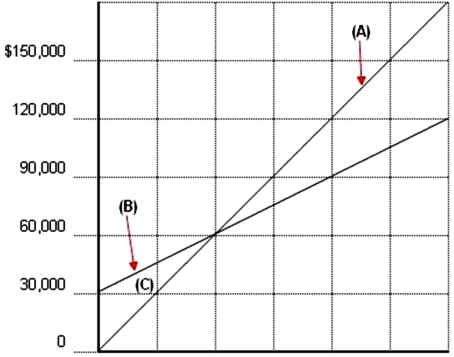
A) $0
B) $25,000
C) $60,000
D) $30,000
Correct Answer:

Verified
Correct Answer:
Verified
Related Questions
Q3: Which of the following statements about a
Q9: Beacon Company makes a product that has
Q20: Anton Company produces and sells bicycles for
Q60: The accuracy of cost-volume-profit analysis is limited
Q72: Cooper Company sells a product at $50
Q75: Which of the following is not an
Q84: Jasper Company has variable costs per unit
Q86: Fox Company believes that a market exists
Q90: Ng Company sells one product that has
Q119: Chesterfield Corporation has been operating well above