Multiple Choice
Consider the following cost-volume-profit graph: Based on the information in the graph, the breakeven point in sales dollars is approximately equal to: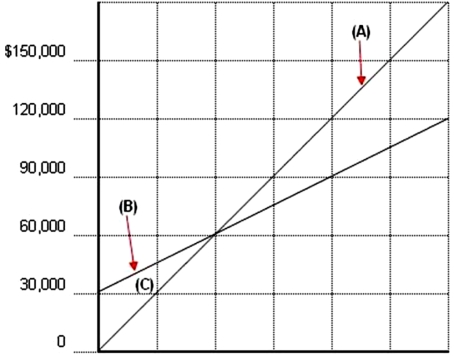
A) $50,000.
B) $30,000.
C) $60,000.
D) $20,000.
Correct Answer:

Verified
Correct Answer:
Verified
Related Questions
Q6: Which of the following statements regarding cost-volume-profit
Q42: When sales price,fixed cost,variable cost,and production volume
Q52: Explain how to calculate contribution margin per
Q95: Techpro has a selling price of $10
Q102: When computing the break-even point in units,a
Q118: Heavener Company produces and sells storage
Q120: Select the term from the list provided
Q121: Crown Company produces and sells two
Q123: The Victor Company sells two products.
Q138: Company X has variable costs per unit