Multiple Choice
In the graph below, which depicts the relationship between units produced and unit cost, the dotted line depicts which type of cost per unit? 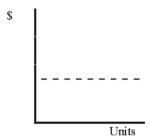
A) Variable cost
B) Fixed cost
C) Mixed cost
D) None of these
Correct Answer:

Verified
Correct Answer:
Verified
Related Questions
Q6: When using least-squares regression to determine variable
Q11: What is the high-low method used for?
Q12: Describe the steps in the high-low method.
Q14: The following income statement is provided
Q42: Carson Corporation's sales increase from $500,000 to
Q49: Fixed cost per unit:<br>A) decreases as production
Q65: Multiple regression analysis should be performed when
Q80: The activity base selected determines whether a
Q121: What advantages does the regression method of
Q129: How does total fixed cost behave when